

A percentile table by age bracket, the clinical threshold for sarcopenia risk, and what a 140,000-person Lancet study found about grip and long-term mortality.
Grip strength is one of the strongest single predictors of long-term health outcomes available. It's also one of the simplest to measure. A dynamometer, three squeezes, and a number in kilograms. What that number means depends on your age and sex, and how it changes over time matters more than any single result.
What the number predicts
A 2015 study in The Lancet followed 139,691 adults across 17 countries for a median of four years. Every 5-kg decrease in grip strength was associated with a 16% higher risk of all-cause mortality, a 17% higher risk of cardiovascular death, and a 9% higher risk of stroke. Grip strength predicted mortality more strongly than systolic blood pressure did (Leong et al., The Lancet, 2015).
That is not the whole story. Grip strength doesn't do anything by itself. It's a proxy for total-body strength, muscle mass, and neurological integrity. It's the number that tells you how the wider system is doing.
The intervention that moves grip is the same intervention that appears to lower the risk: load the hands under weight that matters, consistently, over years. Deadlifts. Farmer's carries. Dead hangs. Pull-ups.
Below are the percentile values for adult dominant-hand grip strength, in kilograms, by 5-year age bracket. Source: iGRIPS international normative data (Tomkinson et al., J Sport Health Sci, 2025), pooled from approximately 2.4 million adults across 69 countries. This is the current international gold standard.
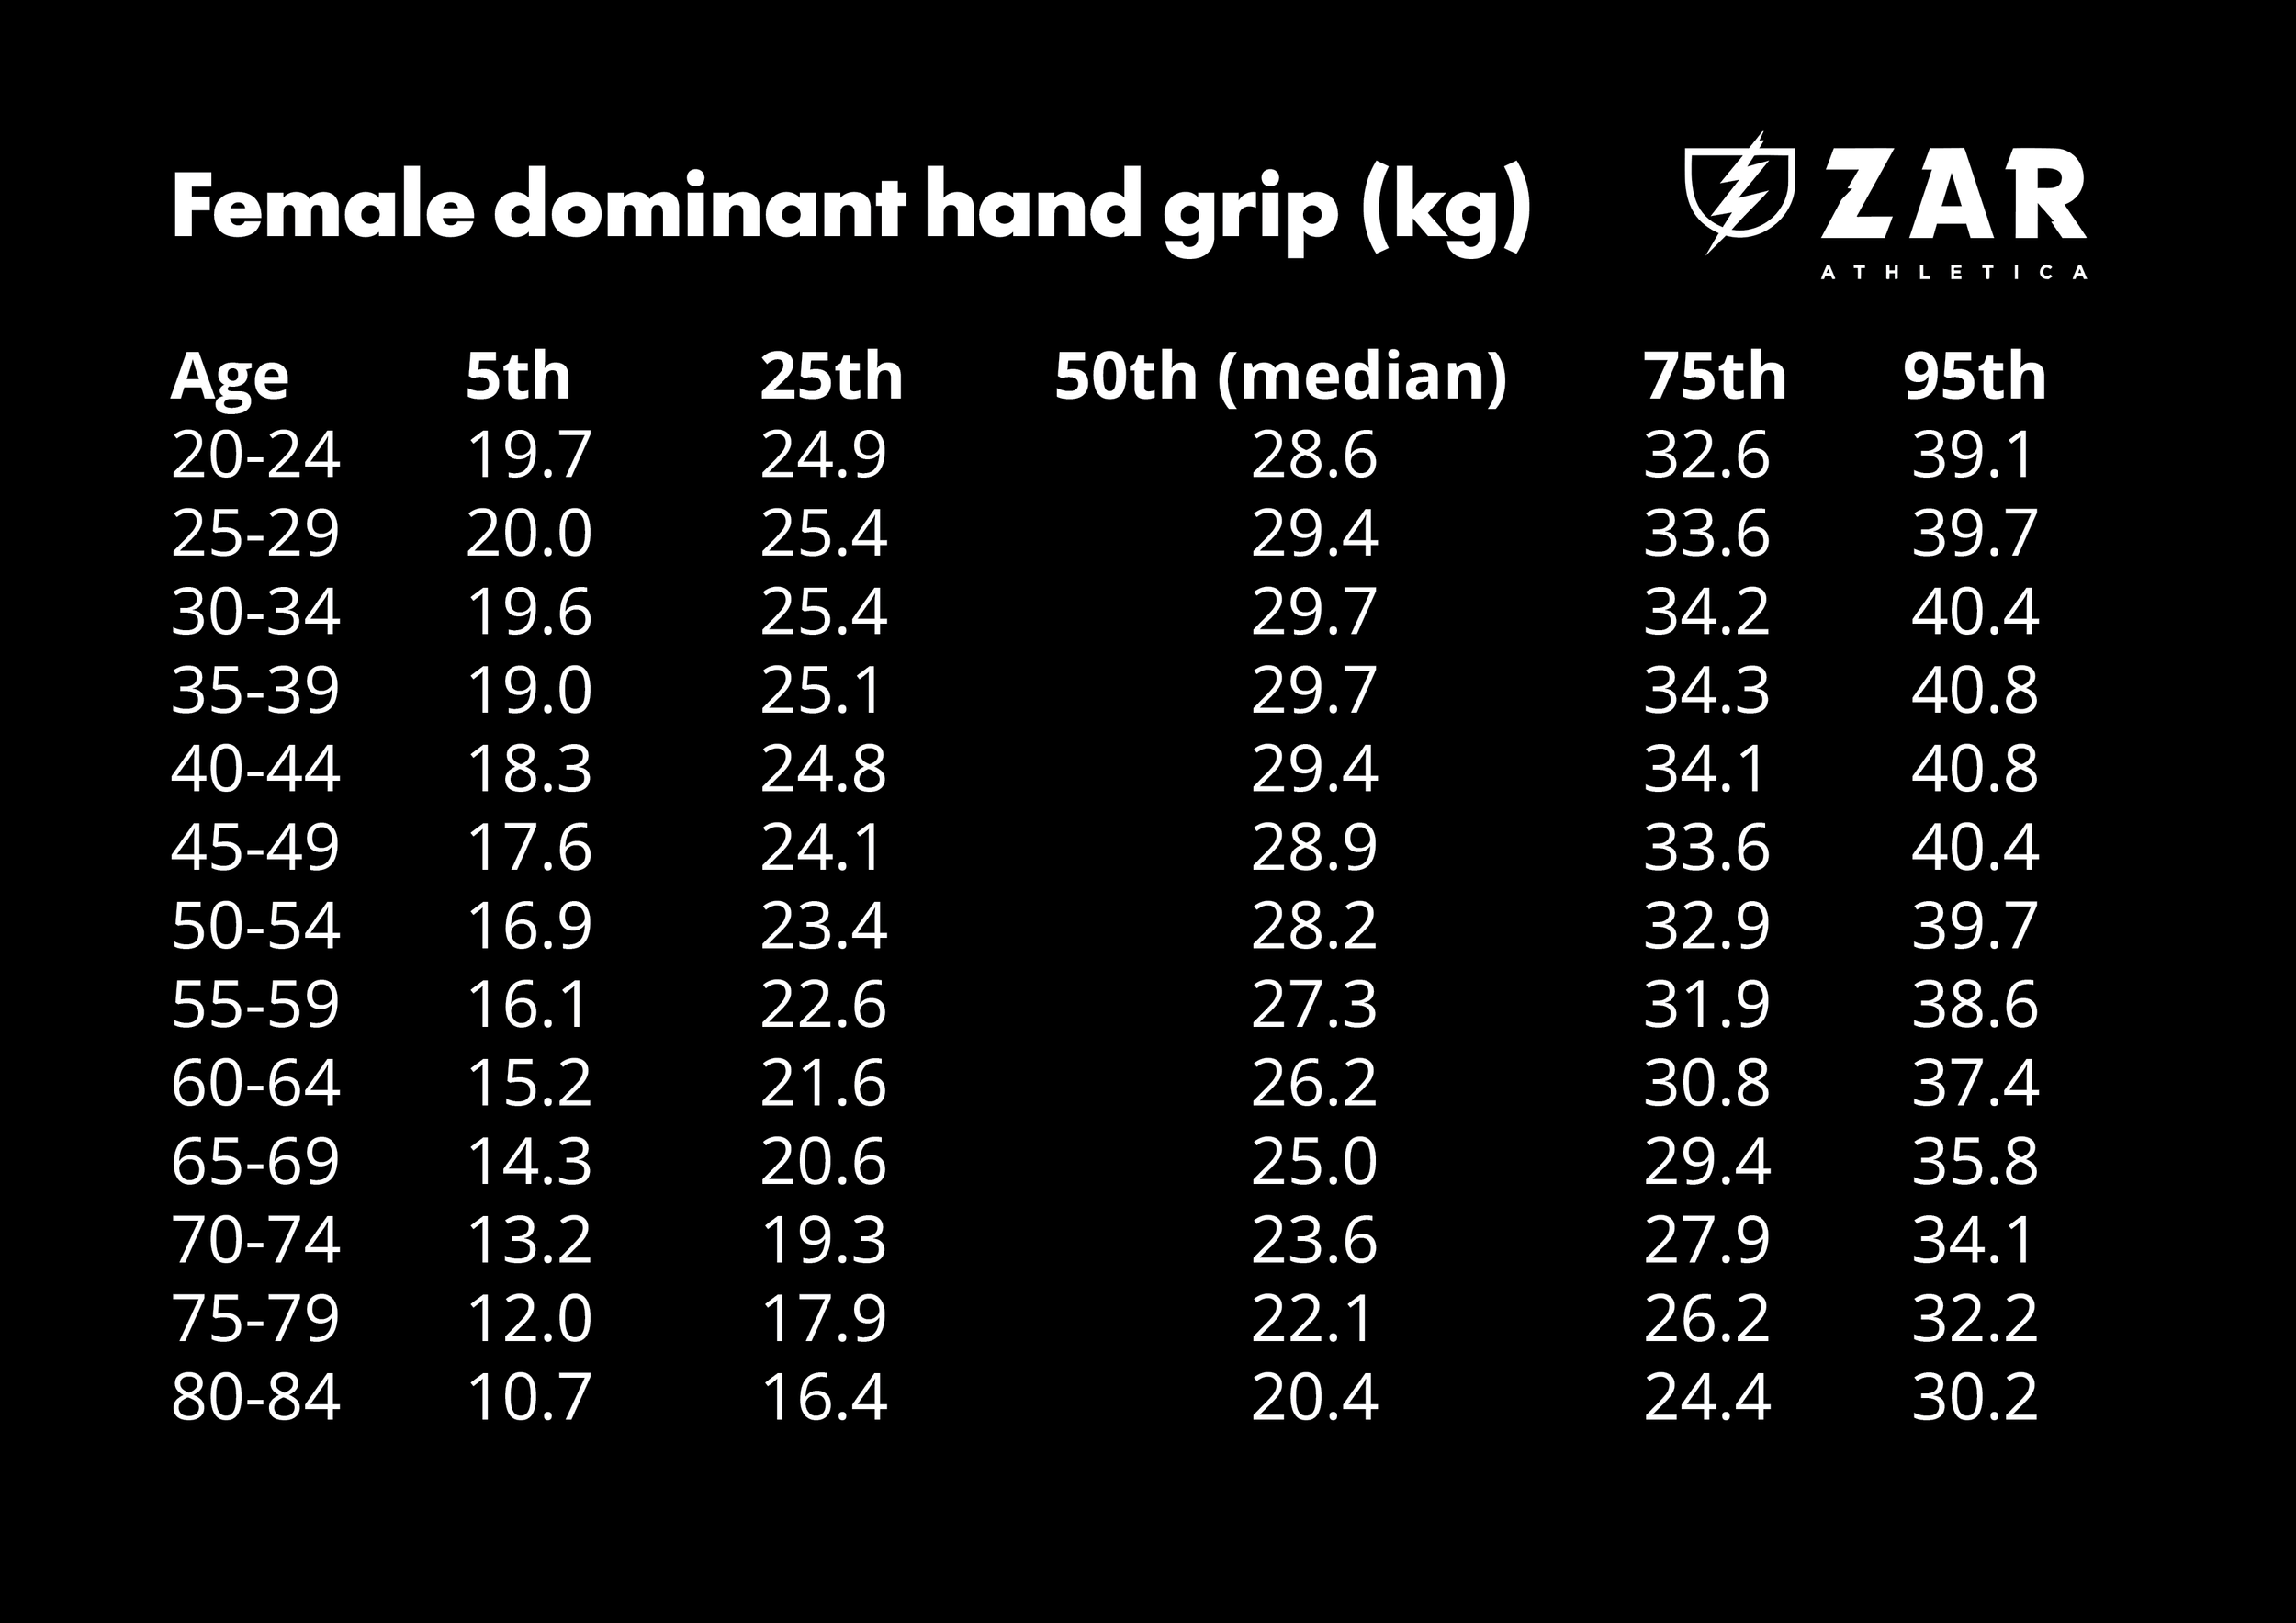
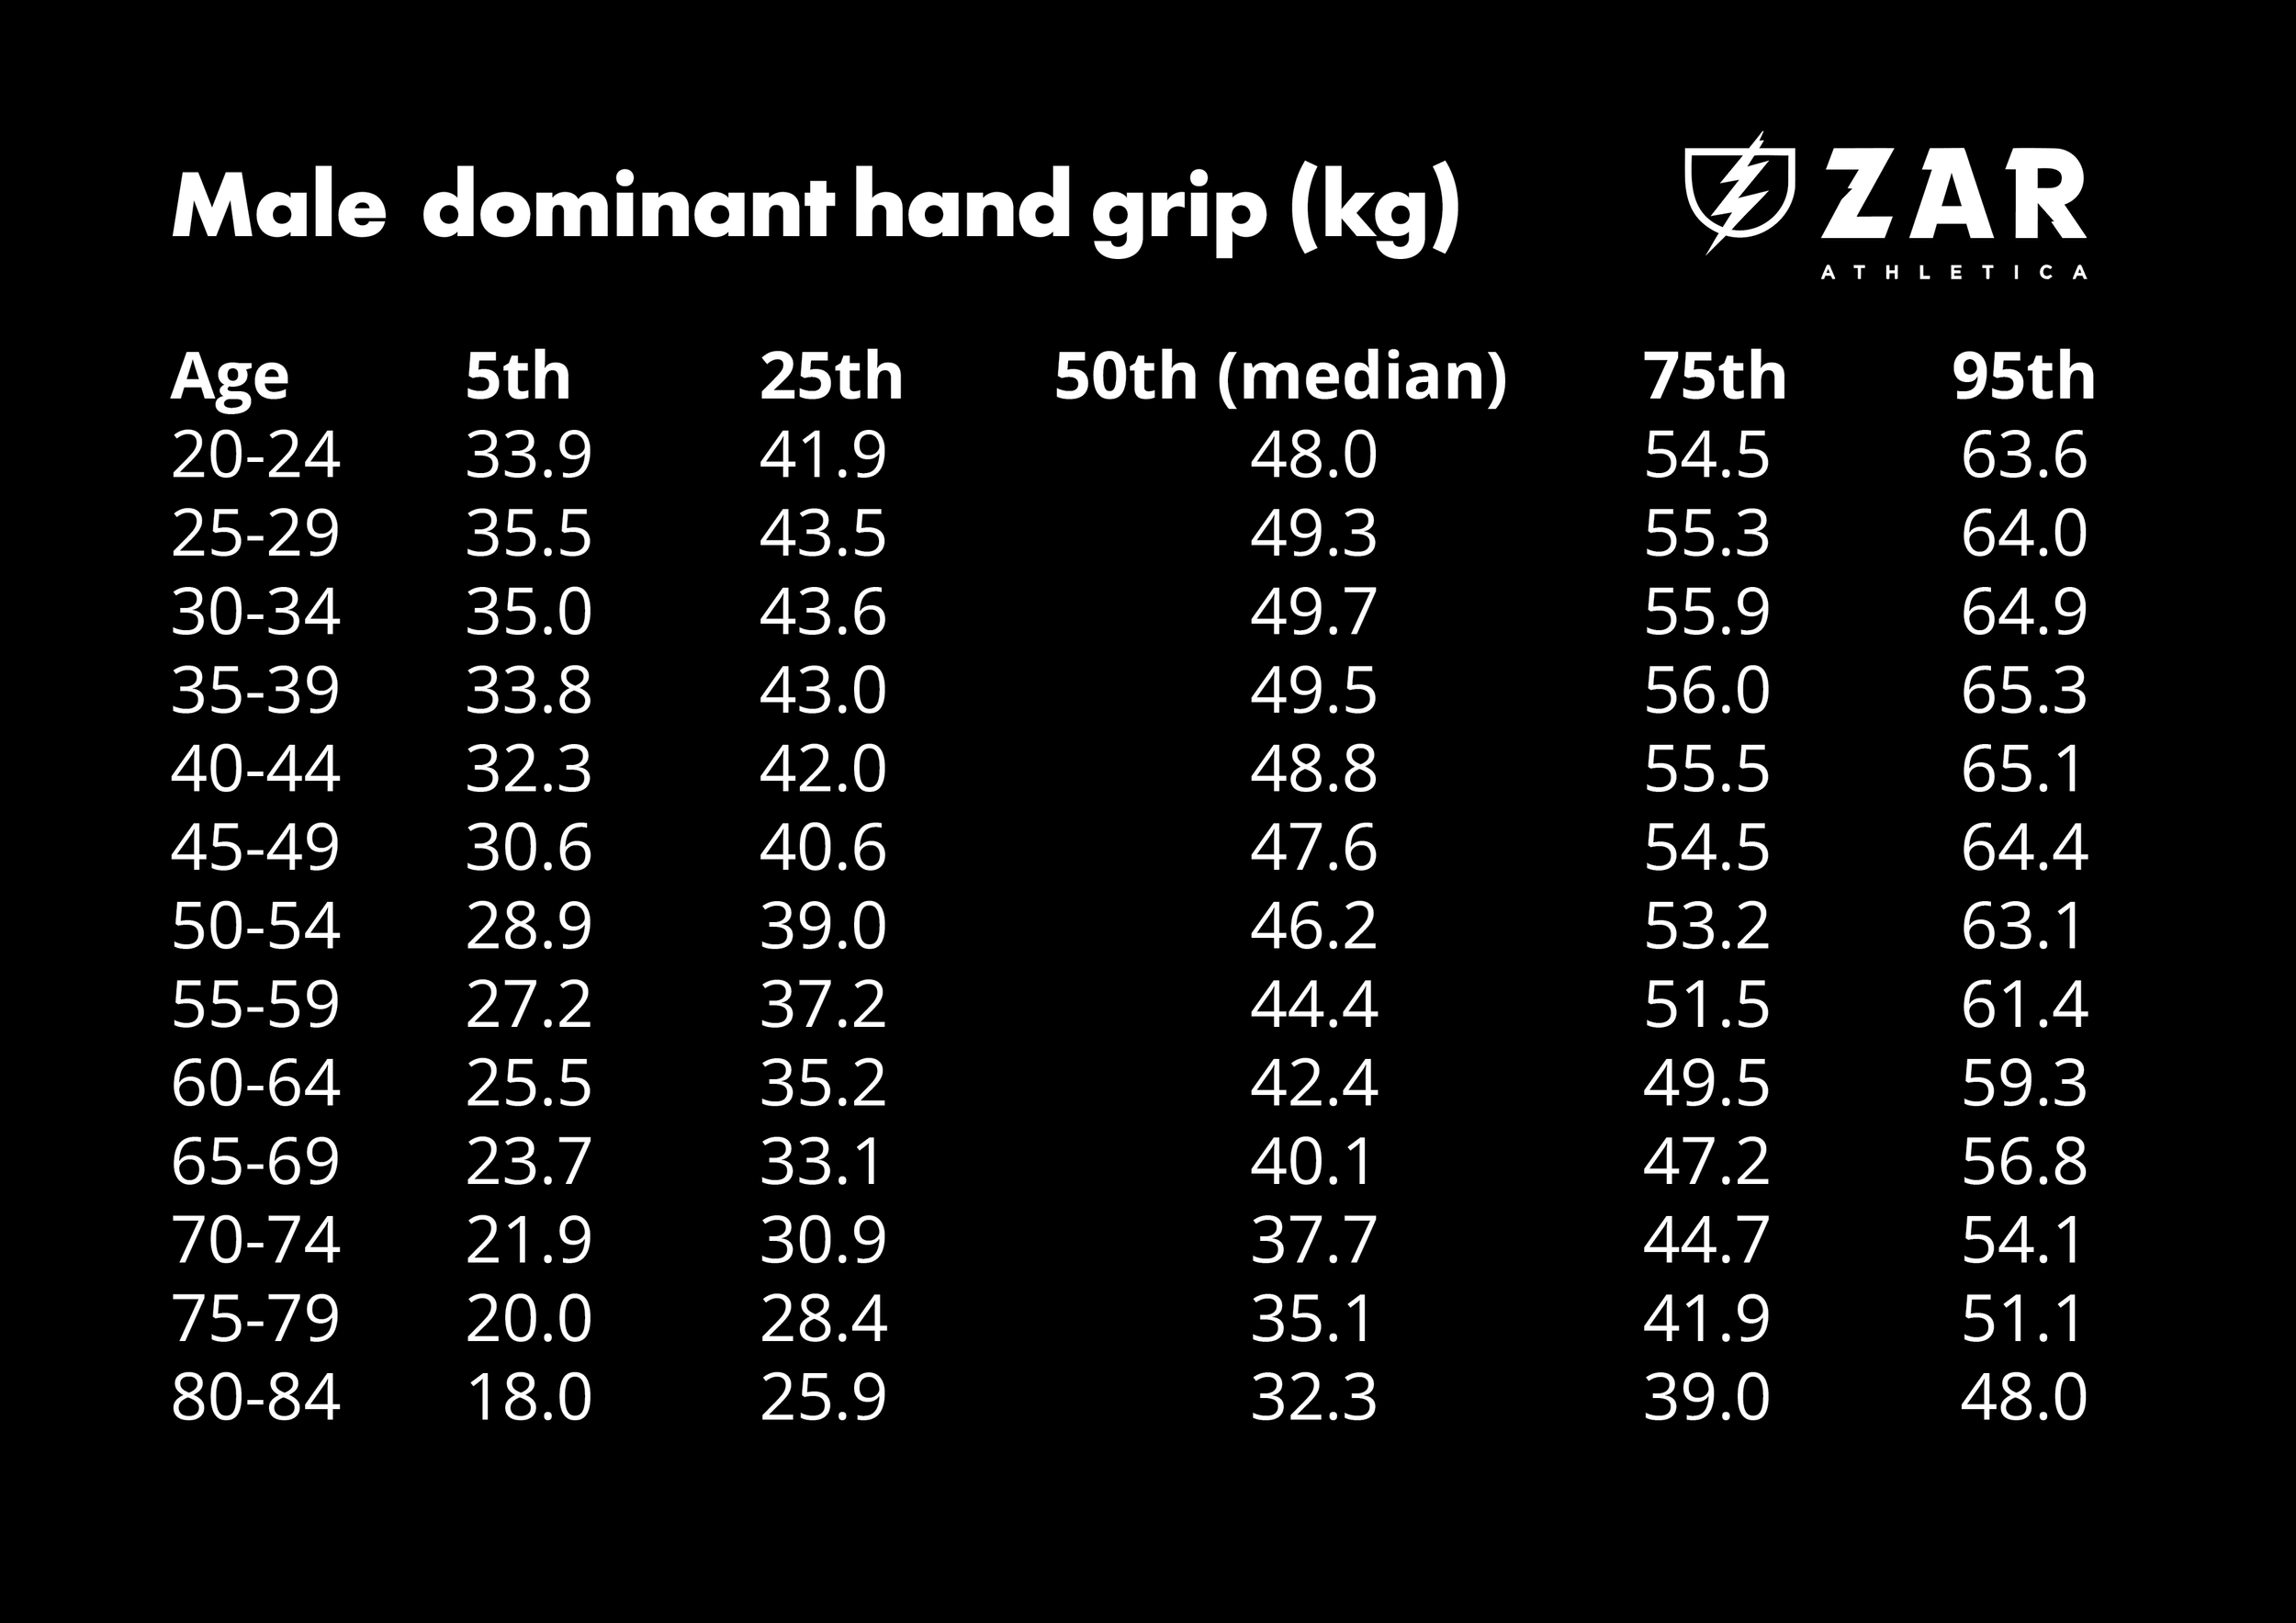
How to read the chart
Below 5th percentile: well below average for your age and sex. Worth speaking to a GP or exercise physiologist about.
5th-25th: below average. A number worth working on.
25th-75th: average. Right in the middle for your age and sex.
75th-95th: above average. Strong for your age and sex.
Above 95th: exceptional. Top 5% for your age and sex.
The European Working Group on Sarcopenia in Older People uses two additional clinical thresholds: below 27 kg for men and below 16 kg for women flag a risk of sarcopenia and warrant clinical follow-up, regardless of age (Cruz-Jentoft et al., Age Ageing, 2019).
Where you sit today is less useful than where you sit over time
A single grip strength result is a data point. The number becomes meaningful when you have two of them, twelve months apart. A stable or improving grip strength across your 50s and 60s says something specific about your training, your recovery, and the systems around your muscle mass. A slowly declining number says something else.
If you're going to have grip tested, treat the first result as a baseline. Retest it. Watch the trend.
References
Leong DP et al. Prognostic value of grip strength: findings from the PURE study. The Lancet, 2015. DOI: 10.1016/S0140-6736(14)62000-6
Tomkinson GR et al. International norms for adult handgrip strength. J Sport Health Sci, 2025. DOI: 10.1016/j.jshs.2024.101014
Cruz-Jentoft AJ et al. Sarcopenia: revised European consensus on definition and diagnosis (EWGSOP2). Age Ageing, 2019. DOI: 10.1093/ageing/afy169